Dashboard
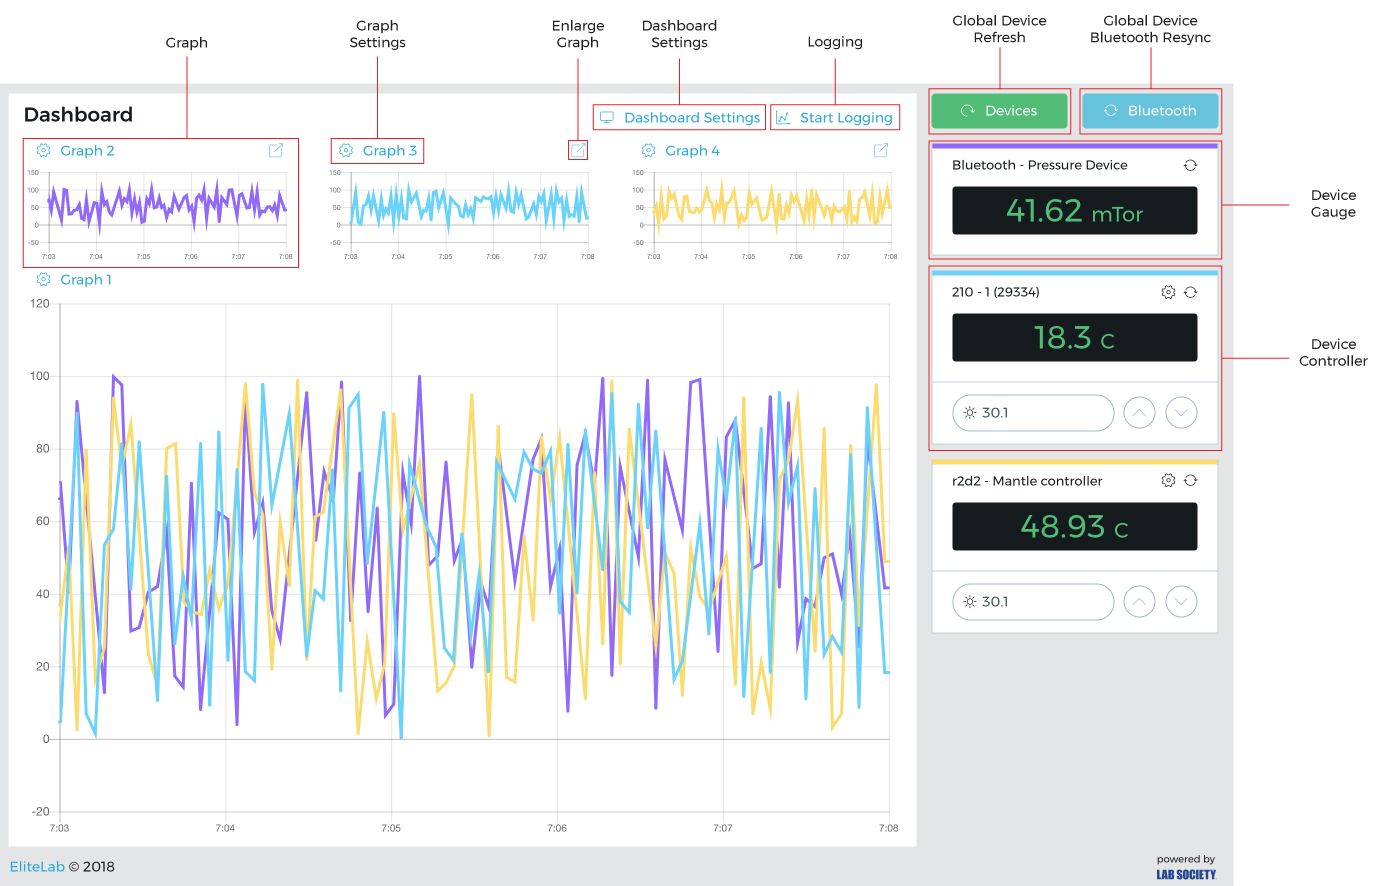
The Dashboard gives the user the ability to display up to 4 graphs with any given number of devices displaying on each graph. Additionally, The Dashboard also displays any currently connected meters, displayed as separate modules to the right of the graphs.
Graph
Each graph displays any given number of devices based on the users input.
Graph Settings
Each graph can be customized to suit the user’s needs. Below will outline all of the available settings for a graph.
Graph Name
The name given to the graph by the user to help identify what it is being used for. Default name will be Graph 1-4 respectively.
X Time Range
The time range visible on the X-Axis of the graph. The default is 5 Minutes.
Y Range (min - max)
The minimum and maximum values shown on the Y-Axis graph. The default setting is auto and will expand and contract relative to the values output on the graph.
Meters to Display
The user has the option to select which meters will be displayed on the currently selected graph. Blue indicates the meter is active and available to be used on a graph. Click on the color square to change what color the device will display as on the graph Click on the Sync button to resync the device.
Enlarge Graph
Clicking on the Enlarge Graph button will swap the graph into the Large Graph space and move the current Large graph into the smaller graph space.
Dashboard Settings
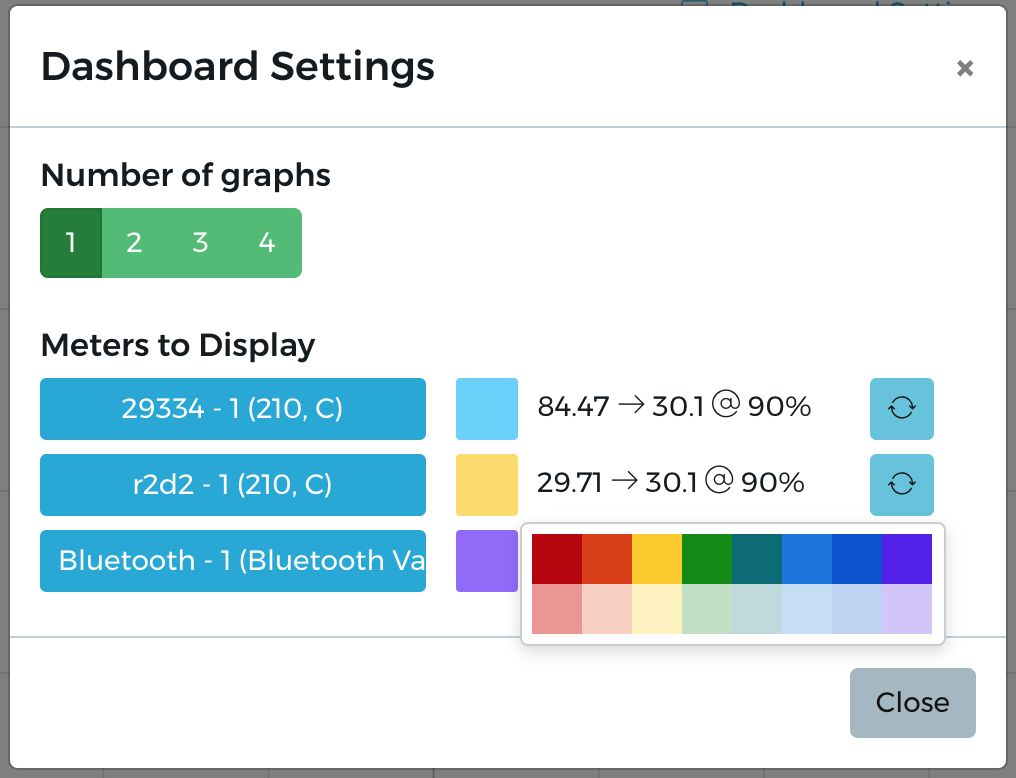
Select the Dashboard settings button to customize the view of the dashboard.
Number of Graphs
Select how many graphs to display on the dashboard.
Meters to Display
The user has the option to select which meters will be available to be displayed on the dashboard graphs.
Blue indicates the meter is active and displaying on the graph. Click on the color square to change what color the device will display as on the graph. Click on the Sync button to resync the device if issues are arising.
Device Refresh
Click the Refresh button if the device is not displaying correctly.
Start Logging
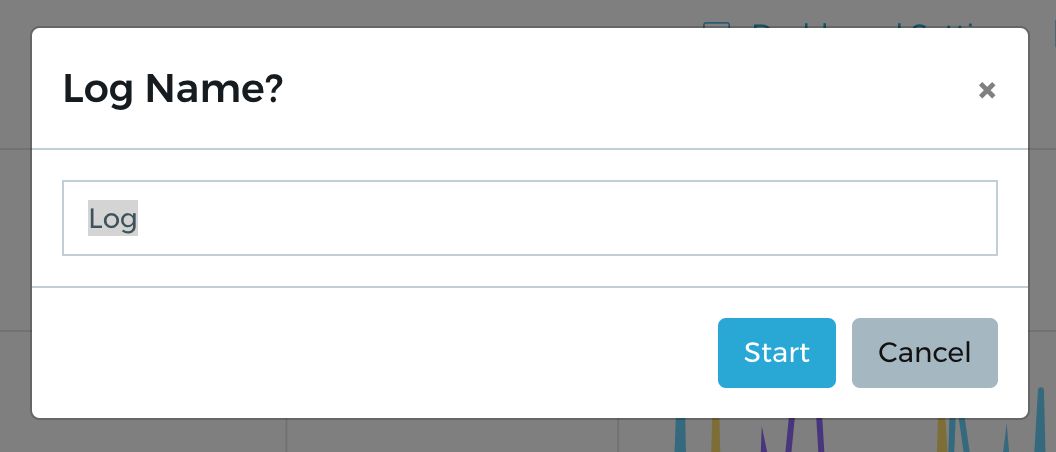
To start a log of the current session select the ‘Start Logging’ button, give the log a name and select ‘Start’ .
To stop the logging process, at anytime select ‘Stop Logging’ where it previously said ‘Start Logging’ .
Global Device Refresh

If issues arise and meters are no longer displaying or logging data, a global device reset will look to all connected devices and attempt to reconnect any device that is having issues.
Global Bluetooth Resync

If issues arise with bluetooth connected devices and meters are no longer displaying or logging data, a Global Bluetooth Resync will look to all connected devices and attempt to resync with any Bluetooth device that is having issues.
Device Gauge and Device Controller
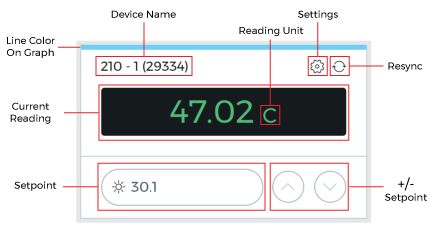
Every device registered in the system is available to display on the dashboard. Each module represents 1 device on the graphs and any changes to a given module will effect all lines on the graphs that represent that module.
Device Name
The name of the device, will display either the custom name provided by the user or the default name of the device if no custom name was registered.
Line Color on Graph
The top of each module will display the color that device is represented by on the graphs.
Current Reading
The current real-time value of that particular meter.
Reading Unit
The unit of measurement of the current reading depending on the particular device (C/F/mTor)
Setpoint
The value of the next setpoint.
Set Point +/-
Increase or decrease the value of the current setpoint one unit at a time.
Resync
If a device is failing due disconnection the resync button will fix the problem.
Settings
Will open up additional settings for adjusting power level and starting a Ramp Program.
Power Level
The set power level for each given step.
Ramp Selection and Settings
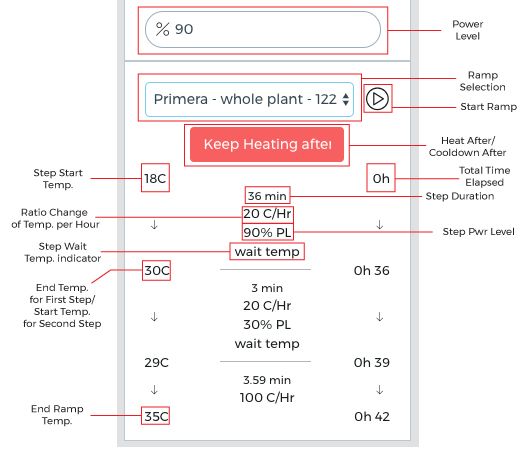
The Ramp selection and settings area is a quick way to initialize pre-existing ramps from the dashboard. Below will outline all of the various aspects of the Ramp selection and settings area.
Play Button
Starts the Ramp selected from the dropdown.
Keep Heating After/ Cooldown After Indicator
Indicates whether the device is set to continue heating or Cooldown after the Ramp has finished running.
Step Start Temperature
Indicates the current starting temperature of the device at the start of the ramp/step. Step End Temperature for First Step / Start Temperature for Second Step Indicates what the temperature will be at the end of the first step of the ramp and the beginning of the second step of the ramp.
End Ramp Temperature
Indicates the ending temperature of the Ramp when it has completed running.
Total Time Elapsed
The time elapsed between each step.
Step Duration
The length of time set for each step to occur.
Temperature Rate of Change
Indicates the rate of change (speed) at which the temperature will ramp from the Step Start Temperature and Step End Temperature.
Step Power Level
The level of power the device will be running at over the duration of the step. Note that the power level selector knob on a controller will override the power level set in the program. If you wish to control the Power Level from the software entirely, set the physical knob to max setting and utilize the ramp creator to ramp up power level.
Step Wait Temperature Indicator
Indicates whether the step should wait for the temperature to reach the desired setpoint even after the step duration time has lapsed; before moving onto the next step.